Por favor, use este identificador para citar o enlazar este ítem:
https://repositorio.uca.edu.ar/handle/123456789/5489| Campo DC | Valor | Lengua/Idioma |
|---|---|---|
| dc.contributor.author | Yuchechen, Adrian E. | es |
| dc.contributor.author | Lakkis, Susan Gabriela | es |
| dc.contributor.author | Canziani, Pablo O. | es |
| dc.date.accessioned | 2019-06-06T00:48:30Z | - |
| dc.date.available | 2019-06-06T00:48:30Z | - |
| dc.date.issued | 2017 | - |
| dc.identifier.citation | Yuchechen, A.E., Lakkis, S.G., Canziani, P.O. Linear and non-linear trends for seasonal NO2 and SO2 concentrations in the southern hemisphere (2004-2016) [en línea]. En Remote sensing 9(9), 2017. Disponible en: https://repositorio.uca.edu.ar/handle/123456789/5489 | es |
| dc.identifier.issn | 2072-4292 | - |
| dc.identifier.uri | https://repositorio.uca.edu.ar/handle/123456789/5489 | - |
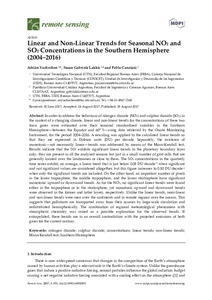
| dc.description.abstract | Abstract: In order to address the behaviour of nitrogen dioxide (NO2) and sulphur dioxide (SO2) in the context of a changing climate, linear and non-linear trends for the concentrations of these two trace gases were estimated over their seasonal standardised variables in the Southern Hemisphere—between the Equator and 60 S—using data retrieved by the Ozone Monitoring Instrument, for the period 2004–2016. A rescaling was applied to the calculated linear trends so that they are expressed in Dobson units (DU) per decade. Separately, the existence of monotonic—not necessarily linear—trends was addressed by means of the Mann-Kendall test. Results indicate that the SO2 exhibits significant linear trends in the planetary boundary layer only; they are present in all the analysed seasons but just in a small number of grid cells that are generally located over the landmasses or close to them. The SO2 concentrations in the quarterly time series exhibit, on average, a linear trend that is just below 0.08 DU decade-1 when significant and not significant values are considered altogether, but this figure increases to 0.80 DU decade-1 when only the significant trends are included. On the other hand, an important number of pixels in the lower troposphere, the middle troposphere, and the lower stratosphere have significant monotonic upward or downward trends. As for the NO2, no significant linear trends were found either in the troposphere or in the stratosphere, yet monotonic upward and downward trends were observed in the former and latter layers, respectively. Unlike the linear trends, semi-linear and non-linear trends were seen over the continents and in remote regions over the oceans. This suggests that pollutants are transported away from their sources by large-scale circulation and redistributed hemispherically. The combination of regional meteorological phenomena with atmospheric chemistry was raised as a possible explanation for the observed trends. If extrapolated, these trends are in an overall contradiction with the projected emissions of both gases for the current century. | es |
| dc.format | application/pdf | es |
| dc.language.iso | eng | es |
| dc.publisher | MDPI | es |
| dc.rights | Acceso Abierto | es |
| dc.rights.uri | https://creativecommons.org/licenses/by-nc-sa/4.0/ | es |
| dc.source | Remote sensing Vol. 9 Nº 9, 2017 | es |
| dc.subject | CAMBIO CLIMATICO | es |
| dc.subject | HEMISFERIO SUR | es |
| dc.subject | DIOXIDO DE NITROGENO | es |
| dc.subject | DIOXIDO DE AZUFRE | es |
| dc.subject | PRUEBA DE MANN-KENDALL | es |
| dc.subject | CLIMATOLOGIA | es |
| dc.subject | INVESTIGACION | es |
| dc.title | Linear and non-linear trends for seasonal NO2 and SO2 concentrations in the southern hemisphere (2004-2016) | es |
| dc.type | Artículo | es |
| dc.identifier.doi | 10.3390/rs9090891 | - |
| uca.path | Facultad de Ingeniería y Ciencias Agrarias|Artículos | es |
| uca.disciplina | INGENIERIA | es |
| uca.filename | /home/data-uca-generic/folder_generic_common/Ing. y Cs.Agrarias/Art�culos/linear-non-linear-trends-seasonal/metadata.xml | es |
| uca.issnrd | 1 | es |
| uca.affiliation | Fil: Yuchechen, Adrián E. Consejo Nacional de Investigaciones Científicas y Técnicas; Argentina | es |
| uca.affiliation | Fil: Yuchechen, Adrián E. Universidad Tecnológica Nacional. Facultad Regional Buenos Aires. Unidad de Investigación y Desarrollo de las Ingenierías; Argentina | es |
| uca.affiliation | Fil: Lakkis, Susan Gabriela. Universidad Tecnológica Nacional. Facultad Regional Buenos Aires. Unidad de Investigación y Desarrollo de las Ingenierías; Argentina | es |
| uca.affiliation | Fil: Lakkis, Susan Gabriela. Pontificia Universidad Católica Argentina. Facultad de Ingeniería y Ciencias Agrarias; Argentina | es |
| uca.affiliation | Fil: Canziani, Pablo O. Consejo Nacional de Investigaciones Científicas y Técnicas; Argentina | es |
| uca.affiliation | Fil: Canziani, Pablo O. Universidad Tecnológica Nacional. Facultad Regional Buenos Aires. Unidad de Investigación y Desarrollo de las Ingenierías; Argentina | es |
| uca.version | publishedVersion | es |
| item.grantfulltext | open | - |
| item.fulltext | With Fulltext | - |
| item.languageiso639-1 | en | - |
| crisitem.author.dept | Pontificia Universidad Católica Argentina | - |
| crisitem.author.dept | Facultad de Ingeniería y Ciencias Agrarias | - |
| crisitem.author.orcid | 0000-0001-7562-8204 | - |
| crisitem.author.parentorg | Pontificia Universidad Católica Argentina | - |
| Aparece en las colecciones: | Artículos | |
Ficheros en este ítem:
| Fichero | Descripción | Tamaño | Formato | |
|---|---|---|---|---|
| linear-non-linear-trends-seasonal.jpg | 5,81 kB | JPEG |  Visualizar/Abrir | |
| linear-non-linear-trends-seasonal.pdf | 1,43 MB | Adobe PDF |  Visualizar/Abrir |
Visualizaciones de página(s)
161
comprobado en 30-abr-2024
Descarga(s)
239
comprobado en 30-abr-2024
Google ScholarTM
Ver en Google Scholar
Altmetric
Altmetric
Este ítem está sujeto a una Licencia Creative Commons

